Knowledge Base
We give you the information you need at hand, descriptive and brief for what you need to know about our ESMTcx services.

Collect Chrome Console Logs in Genesys Cloud
Log in for the first time in Genesys
Conversation Categories Whatsapp Business
Forgotten Genesys Cloud Passwords
How to get the conversation id of an interaction in genesys cloud
Disable your browser's sleep mode setting
Troubleshoot Genesys Cloud before contacting Product Support
Gather network logs from Chrome
Gather network logs on Firefox
Gather network logs from Safari
Gather network logs from Desktop App
Genesys Cloud system requirements
Collect Chrome Console Logs in Genesys Cloud
- It's normal to see the trace already running in the console when you open it.
When issues occur, console and network logs provide visibility into actions and events on an agent's computer. When combined with cloud logging, browser logs (console and network logs) give customer service a complete picture of an issue. Troubleshooting without complete information can be difficult, if not impossible.
The method to get a console log on Mac and Windows is the same:
1. In your Chrome browser, click on and then More Tools > Developer Tools.
Note:
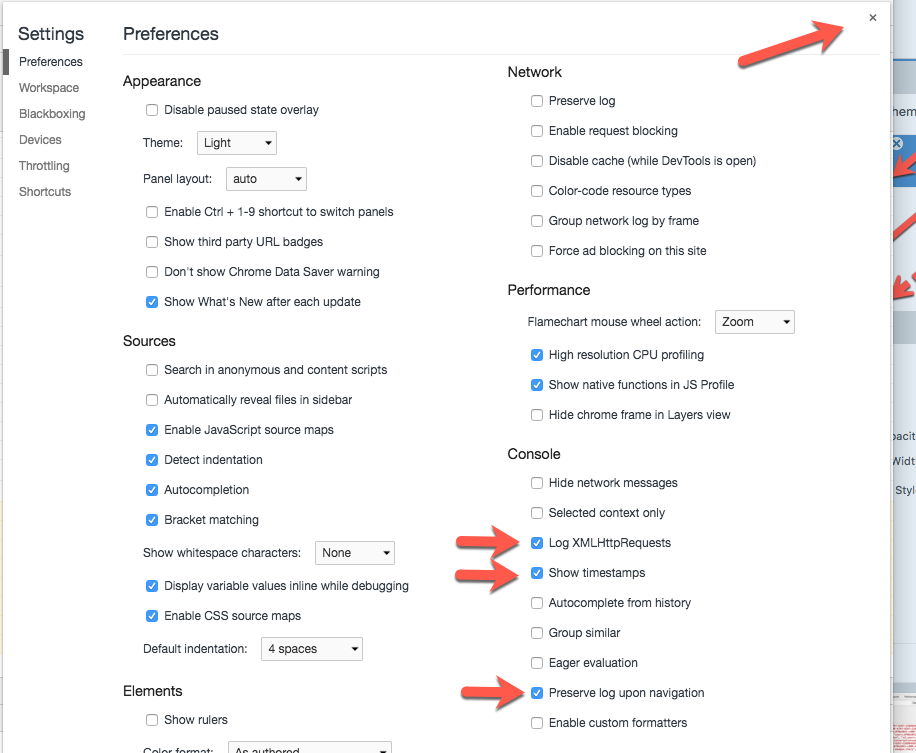
2. At the top right of the Developer Tools menu, click the settings icon
3. In the Console section, click the following check boxes:
- XMLHttpRequests Logger
- Show Timestamps
- Keep Navigation Log
4. To close the page, click in the top right corner.
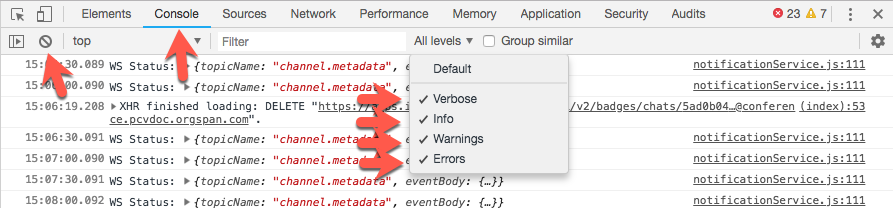
5. On the Console tab , to the right of the Filter field , click the Log Level list and select any filter levels that are not already selected. When you select all levels, the log level selection reads All Levels .
6. To clear the console, click .
7. Leave the console open and reproduce the steps for the issue under investigation.
8. After reproducing the issue, return to the console.
9. Right click and save the log file.
Use :
- If you copy or move log files shortly after saving them, they may become corrupted. Make sure to wait for the data transfer to complete after saving the file, then move the file to a different location or upload it to the support ticket.
10. Upload the file to the support ticket along with any other requested information. Use My Support to open and manage your support cases.